Earth is a diverse place, with millions of species, and thousands of languages. Yet, when we think about diversity, our minds gravitate towards biodiversity, or the variety of life (usually plant and animal) in a particular area. But the same applies to linguistic diversity, or the diversity of languages in a particular area. On The Language Closet, we have covered how similar geographical patterns can occur in the diversity of biological life, and languages. Thus today, we will be covering some methods in measuring this diversity we see. So, it is time to put my background in biology and biostatistics, and my interest in languages and linguistics to good use, and introduce the various mathematics behind evaluating linguistic diversity.
At first sight, there are some significant overlap in the indices and methods currently used to measure biological diversity and linguistic diversity. Quite often in literature, we see several ecological concepts spill over into linguistics, although a substantial portion of these methods we are going to encounter here technically originate in information theory. We will explore each of them from the ecological side first, and then how they are applied in the context of linguistic diversity.
The first, and probably the simplest method is to just count the number of species that can be found in a given area. This is called richness. While it is a simple count of different species in a predefined geographical area, quadrat, or sample, it leaves out plenty of information concerning the makeup of the community there.
For one, the main criterion to be counted as a species is to simply exist in that particular sampled area. A million individuals of the same species found in that area would still count as one species, just as a single individual of a given species in that area would count as one species. We also do not know if that particular species is found in other areas, or if it is just restricted to this particular sampled area. In order words, we do not know if the species found in that area is endemic.
Similarly, to assess linguistic diversity, we could evaluate the richness (R) by counting the number of languages spoken in an area. This could be a geographically defined region, city, or country. For example, if English is spoken or used in a particular city defined by its city limits, then there is only one language spoken in that city, or R = 1.
Just like how species with fewer individuals are overrepresented by richness, languages with fewer speakers are overrepresented by this measure. If City X has 98% of its residents using language A, and 2% of its residents using language B, City Y has 50% of its residents using language A, and 50% of its residents using language B, and both City X and City Y have identical population sizes, despite both cities having the same richness R, how the speakers are distributed within each city is not accounted for.
This brings us to the next concept in measuring diversity, that is evenness. This provides more information on how common or how rare a species is. But in evaluating this, one would need to know how many individuals of a certain species there are in that area. In ecology, this is pretty difficult to determine precisely, and so these abundances are done by estimations derived from sampling methods like mark and recapture. But for linguistics, this mileage may vary. For some countries or regions, census data might be able to capture the languages predominantly used by individuals, while for others, particularly in more remote areas, estimations may be the most preferred method.
While evenness tells us how uniform species or languages are distributed, it is rarely used alone in evaluating biodiversity and linguistic diversity. It is normally combined with richness to give us an index of biodiversity. This leads us to the two most well-known indices of biodiversity.
The first index we will talk about takes after a rather intuitive concept. In a sampled quadrat in a particular habitat, what is the probability that any 2 individuals randomly selected from this sample are of the same species? Similarly, in a given city’s population of say, 1 million individuals, what is the probability that any 2 individuals randomly selected from this population speak different languages?
The first question gives us the Simpson index, and is expressed using this handy mathematical equation:

Building on the Simpson index, one might be interested to know the probability that two randomly selected individuals from a given area are of different species. This is basically 1, minus the probability given by the Simpson index, as you would want to exclude every case where two randomly selected individuals are of the same species. This is referred to as the Gini-Simpson index, and is expressed as:
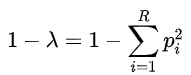
It is the Gini-Simpson index that was adapted by linguist Joseph Harold Greenberg to give the Greenberg Diversity Index or LDI. This answers our second question several paragraphs above, where we asked, “in a given city’s population of say, 1 million individuals, what is the probability that any 2 individuals randomly selected from this population speak different languages?”
If we get a value of 0, it tells us that everyone in the population speaks the same language. Conversely, a value of 1 indicates that everyone in the population speaks a different language. LDI was used by UNESCO to evaluate cultural diversity, and computed an LDI for almost every country in the world. In their 2009 World Report, Investing in Cultural Diversity and Intercultural Dialogue, they found that the highest LDIs were found in Papua New Guinea (0.990), Vanuatu (0.972), and the Solomon Islands (0.965), while the lowest were in Samoa (0.002), Cuba (0.001), and Haiti (0.000).
Interestingly, although the Greenberg index did combine richness and evenness to try to give us a index of linguistic diversity, it is extremely insensitive to the influence exerted by rare languages. In other words, languages spoken by small or minute communities hardly have any influence on the diversity index as a whole. Thus, if one country has three times as many languages as another, but most of these languages are only spoken by a tiny fraction of the population, the resulting Greenberg index might still be rather similar.
So, with richness being greatly sensitive to rare languages, and the Greenberg index being stubbornly insensitive to them, is there an index that could like in the “Goldilocks zone” of sensitivity to rare languages?
The Shannon-Wiener index is another such index widely used in ecology and biodiversity research. While it was originated from the field of information theory, it has found it way into biodiversity and linguistic diversity, where it quantifies the uncertainty in predicting the species (or language used) by an individual that is randomly drawn from a dataset. In a population of richness R, with a proportion of the population speaking a language pi, the Shannon-Wiener index is calculated by:

Going back to our City X vs City Y example, in City X, the Shannon-Wiener index is 0.098, while in City Y, it is 0.693. This means that in a more homogeneous population, you would have less uncertainty in predicting the language used by a randomly drawn person from the population than in a more heterogeneous population. In a case of true diversity, the Shannon-Wiener index would return a value of 1, while in a completely homogeneous population, the Shannon-Wiener index would return 0, meaning that you would know for certain the language spoken by a person randomly selected from the sampled population.
One drawback occurs when change in linguistic diversity occurs. While a fall of, say, 15% in Shannon-Wiener index value occurs for a city in 2023 when compared against 1995, what does that truly represent, other than the interpretation that the population has become more homogeneous in language diversity? Is a drop of 15% a disastrous thing, or a more trivial problem to deal with?
To try to convert that into more intuitive terms, we could ask the question, how many languages does that translate to? In biodiversity, this is referred to as either the numbers equivalent, Hill numbers of order q, the effective number of species, or ‘true diversity’. Essentially, what this number is is the number of species of equal abundances needed to return the same value given by the diversity index. Porting this over to linguistic diversity, it is the number of languages that are spoken by an equal proportion of the population needed to have the same value of the diversity index used.
To derive this number involves quite a bit of mathematics. But the primary steps involve using the proportional abundances (think pi in the previous indices) and obtaining the weighted generalised mean of these abundances Mq-1, and then taking the reciprocal of that. In mathematics terms, it is:
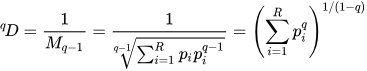
So, what is the q in Mq-1? It is known as the order of diversity, and a larger q would allocate more weight towards the most common species or language. This means that Mq-1 would be larger, resulting in a smaller effective number of species (or languages).
To convert the Gini-Simpson or Greenberg index to this effective number, q is set to 2, indicating that a weighted arithmetic mean should be taken. Putting this into the equation gives us the Inverse Simpson index, as it simplifies to:

But to convert the Shannon-Wiener index to this effective number, q is set to 1, indicating that a weighted geometric mean should be taken. Now we have a little problem. 1/(1-q) is undefined when q=1. So this cannot really be computed directly. Instead, we have to determine the value we would get as q approaches 1. If there is a convergence in that value as q approaches 1, we have a limit. And fortunately, there is a limit. This is the exponent of the value Shannon-Wiener index gives, or:

Among these methods, perhaps the most prominent problem is how multilingualism is accounted for. When we count species, an individual can only be of one particular species. This does not apply to languages, as people can speak or use two or more languages in their daily lives. When we factor in that a typical society has the tendency to have both monolingual and multilingual individuals, and put these values into, say, the Shannon-Wiener index, we get something that do not make sense.
For example, imagine that a City Z has a population where 39% speak Language A, 34% speak Language B, 7% speak Language C, and 35% speak Language D. Look at how these percentages add up if we assume monolingual speakers only. These total to 115% of the city’s population, which does not make sense. Thus, at least a few individuals in the population of City Z speak multiple languages for these to make sense. But what does the Shannon-Wiener index return? We get the value 1.288. This does not make sense, since a value of 1 indicates a heterogeneous population in linguistic diversity. Thus, we can see how indices like this can fall apart if we violate the assumption of monolingual speakers in a population. And in reality, this is more of the norm than the exception.
Another point is, we have not quite defined what a language is. Just like the concept of the species, these lines can be quite blurry. Some might adhere to how mutually unintelligible various languages and language variants can be, while others might factor in geopolitical lines. Alternatively, one could go by the ISO 639 codes, which standardise nomenclature used to classify languages. Others might go by the codes assigned by Glottolog. This could result in different tongues being counted as distinct languages under a certain system, while being just variants of the same language under another. For instance, Serbo-Croatian, or Bosnian-Croatian-Montenegrin-Serbian, is assigned a single language code under Glottolog (sout1528), but has both individual and inclusive codes under ISO 639-3. Linguists might consider it a pluricentric language with four mutually intelligible variants, but geopolitics might suggest that these are actually four distinct languages. Depending on how language is defined, the diversity metrics we obtain would vary.
There are several other concepts of diversity we have not yet touched, but will be interesting to cover given the many similarities between methods in biodiversity and ecology, and methods in studying linguistic diversity. If you would like to explore more about these methods, I recommend reading the paper by Grin and Fürst in 2022, which provides a great introduction to the current practices of measuring linguistic diversity. This paper complemented my preexisting knowledge in ecology and biodiversity to write this piece, and is on open access, so I do recommend checking it out.
Further reading
Grin, F., Fürst, G. Measuring Linguistic Diversity: A Multi-level Metric. Soc Indic Res 164, 601–621 (2022). https://doi.org/10.1007/s11205-022-02934-5.

Pingback: Evaluating linguistic diversity using a different approach | The Language Closet